
Cryo-EM of PAC1 receptor bound to PACAP38 and Gs protein
Liang YL, Belousoff MJ, Zhao P, Koole C, Fletcher MM, Truong TT, Julita V, Christopoulos G, Xu HE, Zhang Y, Khoshouei M, Christopoulos A, Danev R, Sexton PM, Wootten D
Mol. Cell (2020) 77 pp. 656-668.e5 [ Pubmed: 32004469 DOI: 10.1016/j.molcel.2020.01.012 ]
Image sets:

Resolution: 2.4 Å
EM Method: Single-particle
Fitted PDBs: 6uus
Q-score: 0.535
Liang YL, Belousoff MJ, Fletcher MM, Zhang X, Khoshouei M, Deganutti G, Koole C, Furness SGB, Miller LJ, Hay DL, Christopoulos A, Reynolds CA, Danev R, Wootten D, Sexton PM
Acs Pharmacol Transl Sci (2020) 3 pp. 263-284 [ DOI: doi:10.1021/acsptsci.9b00080 Pubmed: 32296767 ]
- Receptor activity-modifying protein 3 (16 kDa, Protein from Homo sapiens)
- Adm (6 kDa, Protein from Homo sapiens)
- Guanine nucleotide-binding protein g(i)/g(s)/g(o) subunit gamma-2 (7 kDa, Protein from Homo sapiens)
- Nanobody 35 (Complex from Lama glama)
- Nanobody 35 (15 kDa, Protein from Lama glama)
- Calcitonin gene-related peptide type 1 receptor (56 kDa, Protein from Homo sapiens)
- Guanine nucleotide-binding protein g(i)/g(s)/g(t) subunit beta-1 (38 kDa, Protein from Homo sapiens)
- Am2:clr:ramp3:gasdn:gb1:gg2:nb35 gpcr complex (Complex)
- Guanine nucleotide-binding protein g(s) subunit alpha isoforms short, guanine nucleotide-binding protein g(i)/g(s)/g(t) subunit beta-1, receptor activity-modifying protein 3, guanine nucleotide-binding protein g(i)/g(s)/g(o) subunit gamma-2, calcitonin gene-related peptide type 1 receptor (Complex from Homo sapiens)
- Adm (Complex from Homo sapiens)
- Guanine nucleotide-binding protein g(s) subunit alpha isoforms short (45 kDa, Protein from Homo sapiens)

Resolution: 2.3 Å
EM Method: Single-particle
Fitted PDBs: 6uva
Q-score: 0.553
Liang YL, Belousoff MJ, Fletcher MM, Zhang X, Khoshouei M, Deganutti G, Koole C, Furness SGB, Miller LJ, Hay DL, Christopoulos A, Reynolds CA, Danev R, Wootten D, Sexton PM
Acs Pharmacol Transl Sci (2020) 3 pp. 263-284 [ DOI: doi:10.1021/acsptsci.9b00080 Pubmed: 32296767 ]
- Receptor activity-modifying protein 3 (16 kDa, Protein from Homo sapiens)
- Protein adm2 (5 kDa, Protein from Homo sapiens)
- Guanine nucleotide-binding protein g(i)/g(s)/g(o) subunit gamma-2 (7 kDa, Protein from Homo sapiens)
- Guanine nucleotide-binding protein g(s) subunit alpha isoforms short (45 kDa, Protein from Homo sapiens)
- Protein adm2 (Complex from Homo sapiens)
- Nanobody 35 (Complex from Lama glama)
- Nanobody 35 (15 kDa, Protein from Lama glama)
- Guanine nucleotide-binding protein g(i)/g(s)/g(t) subunit beta-1 (38 kDa, Protein from Homo sapiens)
- Am2:clr:ramp3:gasdn:gb1:gg2:nb35 gpcr complex (Complex)
- Guanine nucleotide-binding protein g(s) subunit alpha isoforms short, guanine nucleotide-binding protein g(i)/g(s)/g(t) subunit beta-1, receptor activity-modifying protein 3, guanine nucleotide-binding protein g(i)/g(s)/g(o) subunit gamma-2, calcitonin gene-related peptide type 1 receptor (Complex from Homo sapiens)
- Calcitonin gene-related peptide type 1 receptor (56 kDa, Protein from Homo sapiens)

Resolution: 3.0 Å
EM Method: Single-particle
Fitted PDBs: 6uun
Q-score: 0.48
Liang YL, Belousoff MJ, Fletcher MM, Zhang X, Khoshouei M, Deganutti G, Koole C, Furness SGB, Miller LJ, Hay DL, Christopoulos A, Reynolds CA, Danev R, Wootten D, Sexton PM
Acs Pharmacol Transl Sci (2020) 3 pp. 263-284 [ DOI: doi:10.1021/acsptsci.9b00080 Pubmed: 32296767 ]
- Adm (6 kDa, Protein from Homo sapiens)
- Guanine nucleotide-binding protein g(i)/g(s)/g(o) subunit gamma-2 (7 kDa, Protein from Homo sapiens)
- Guanine nucleotide-binding protein g(s) subunit alpha isoforms short, guanine nucleotide-binding protein g(i)/g(s)/g(t) subunit beta-1, receptor activity-modifying protein 2, guanine nucleotide-binding protein g(i)/g(s)/g(o) subunit gamma-2, calcitonin gene-related peptide type 1 receptor (Complex from Homo sapiens)
- Nanobody 35 (Complex from Lama glama)
- Nanobody 35 (15 kDa, Protein from Lama glama)
- Calcitonin gene-related peptide type 1 receptor (56 kDa, Protein from Homo sapiens)
- Guanine nucleotide-binding protein g(i)/g(s)/g(t) subunit beta-1 (38 kDa, Protein from Homo sapiens)
- Am:clr:ramp2:gasdn:gb1:gg2:nb35 gpcr complex (Complex)
- Receptor activity-modifying protein 2 (17 kDa, Protein from Homo sapiens)
- Adm (Complex from Homo sapiens)
- Guanine nucleotide-binding protein g(s) subunit alpha isoforms short (45 kDa, Protein from Homo sapiens)
Cryo-EM of CRF1 receptor bound to CRF and Gs protein
Liang YL, Belousoff MJ, Zhao P, Koole C, Fletcher MM, Truong TT, Julita V, Christopoulos G, Xu HE, Zhang Y, Khoshouei M, Christopoulos A, Danev R, Sexton PM, Wootten D
Mol. Cell (2020) 77 pp. 656-668.e5 [ Pubmed: 32004469 DOI: 10.1016/j.molcel.2020.01.012 ]
Image sets:

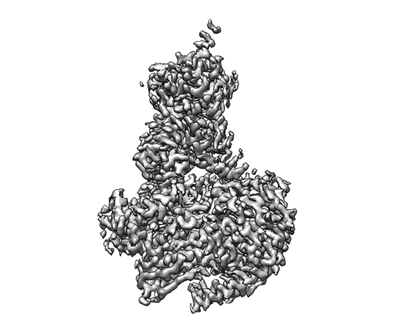
Cryo-EM map of PAC1 receptor bound to PACAP38 and Gs protein
Liang YL, Belousoff MJ, Zhao P, Koole C, Fletcher MM, Truong TT, Julita V, Christopoulos G, Xu HE, Zhang Y, Khoshouei M, Christopoulos A, Danev R, Sexton PM, Wootten D
Mol Cell (2020) 77 pp. 656-668.e5 [ Pubmed: 32004469 DOI: doi:10.1016/j.molcel.2020.01.012 ]
- Pac1 receptor bound to pacap38 and gs protein (150 MDa, Complex from Homo sapiens)
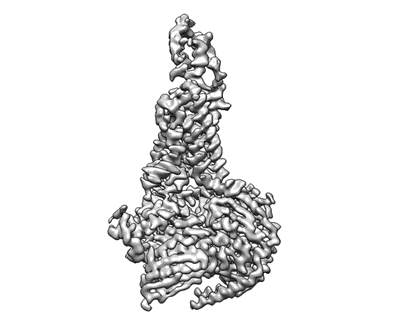
Cryo-EM map of CRF1 receptor bound to CRF and Gs protein
Liang YL, Belousoff MJ, Zhao P, Koole C, Fletcher MM, Truong TT, Julita V, Christopoulos G, Xu HE, Zhang Y, Khoshouei M, Christopoulos A, Danev R, Sexton PM, Wootten D
Mol Cell (2020) 77 pp. 656-668.e5 [ Pubmed: 32004469 DOI: doi:10.1016/j.molcel.2020.01.012 ]
- Crf1 receptor bound to crf and gs protein (150 MDa, Complex from Homo sapiens)
CRF1 Receptor Gs GPCR protein complex with CRF1 peptide.
Resolution: 2.91 Å
EM Method: Single-particle
Fitted PDBs: 6p9x
Q-score: 0.58
Liang YL, Belousoff MJ, Zhao P, Koole C, Fletcher MM, Truong TT, Julita V, Christopoulos G, Xu HE, Zhang Y, Khoshouei M, Christopoulos A, Danev R, Sexton PM, Wootten D
Mol Cell (2020) 77 pp. 656-668.e5 [ Pubmed: 32004469 DOI: doi:10.1016/j.molcel.2020.01.012 ]
- Corticoliberin (4 kDa, Protein from Homo sapiens)
- Guanine nucleotide-binding protein g(i)/g(s)/g(o) subunit gamma-2 (7 kDa, Protein from Homo sapiens)
- Corticoliberin (Complex from Homo sapiens)
- Water (18 Da, Ligand)
- Nanobody 35 (Complex from Lama glama)
- Nanobody 35 (15 kDa, Protein from Lama glama)
- Complex of active-state corticotropin-releasing hormone receptor 1 with heterotrimeric gs protein. (Complex)
- Guanine nucleotide-binding protein g(i)/g(s)/g(t) subunit beta-1 (38 kDa, Protein from Homo sapiens)
- Guanine nucleotide-binding protein g(s) subunit alpha isoforms short (45 kDa, Protein from Homo sapiens)
- Corticotropin-releasing factor receptor 1 (49 kDa, Protein from Homo sapiens)
- Guanine nucleotide-binding protein g(s) subunit alpha isoforms short, guanine nucleotide-binding protein g(i)/g(s)/g(t) subunit beta-1, guanine nucleotide-binding protein g(i)/g(s)/g(o) subunit gamma-2, corticotropin-releasing factor receptor 1 (Complex from Homo sapiens)
Resolution: 3.01 Å
EM Method: Single-particle
Fitted PDBs: 6p9y
Q-score: 0.545
Liang YL, Belousoff MJ, Zhao P, Koole C, Fletcher MM, Truong TT, Julita V, Christopoulos G, Xu HE, Zhang Y, Khoshouei M, Christopoulos A, Danev R, Sexton PM, Wootten D
Mol Cell (2020) 77 pp. 656-668.e5 [ Pubmed: 32004469 DOI: doi:10.1016/j.molcel.2020.01.012 ]
- Guanine nucleotide-binding protein g(s) subunit alpha isoforms short, guanine nucleotide-binding protein g(i)/g(s)/g(t) subunit beta-1, guanine nucleotide-binding protein g(i)/g(s)/g(o) subunit gamma-2, pituitary adenylate cyclase-activating polypeptide (Complex from Homo sapiens)
- Pituitary adenylate cyclase-activating polypeptide type i receptor (Complex from Homo sapiens)
- Pituitary adenylate cyclase-activating polypeptide type i receptor (55 kDa, Protein from Homo sapiens)
- Guanine nucleotide-binding protein g(i)/g(s)/g(o) subunit gamma-2 (7 kDa, Protein from Homo sapiens)
- Nanobody 35 (Complex from Lama glama)
- Nanobody 35 (15 kDa, Protein from Lama glama)
- Guanine nucleotide-binding protein g(i)/g(s)/g(t) subunit beta-1 (38 kDa, Protein from Homo sapiens)
- Guanine nucleotide-binding protein g(s) subunit alpha isoforms short (45 kDa, Protein from Homo sapiens)
- Complex of active-state pituitary adenylate cyclase-activating polypeptide type i receptor with heterotrimeric gs protein. (Complex)
- Pituitary adenylate cyclase-activating polypeptide (4 kDa, Protein from Homo sapiens)