Ground state 26S proteasome (GS2)
Resolution: 12.3 Å
EM Method: Subtomogram averaging
Fitted PDBs: 6epc
Q-score: 0.052
Guo Q, Lehmer C, Martinez-Sanchez A, Rudack T, Beck F, Hartmann H, Perez-Berlanga M, Frottin F, Hipp MS, Hartl FU, Edbauer D, Baumeister W, Fernandez-Busnadiego R
Cell (2018) 172 pp. 696-705.e12 [ DOI: doi:10.1016/j.cell.2017.12.030 Pubmed: 29398115 ]
- Proteasome (prosome, macropain) 26s subunit, non-atpase, 7 (predicted) (36 kDa, Protein from Rattus norvegicus)
- Proteasome subunit alpha type-1 (29 kDa, Protein from Rattus norvegicus)
- Ground state 26s proteasome (gs2) (Complex from Rattus norvegicus)
- Proteasome subunit beta type-5 (28 kDa, Protein from Rattus norvegicus)
- 26s proteasome non-atpase regulatory subunit 11 (47 kDa, Protein from Rattus norvegicus)
- Proteasome subunit alpha type-7 (28 kDa, Protein from Rattus norvegicus)
- Proteasome subunit beta type-1 (26 kDa, Protein from Rattus norvegicus)
- 26s proteasome regulatory subunit 6a (49 kDa, Protein from Rattus norvegicus)
- 26s proteasome regulatory subunit 7 (48 kDa, Protein from Rattus norvegicus)
- Proteasome subunit beta type-4 (29 kDa, Protein from Rattus norvegicus)
- Proteasome 26s subunit, non-atpase 8 (39 kDa, Protein from Rattus norvegicus)
- 26s proteasome non-atpase regulatory subunit 1 (105 kDa, Protein from Rattus norvegicus)
- Proteasome subunit alpha type-3 (28 kDa, Protein from Rattus norvegicus)
- Proteasome subunit alpha type-4 (29 kDa, Protein from Rattus norvegicus)
- 26s proteasome regulatory subunit 8 (45 kDa, Protein from Rattus norvegicus)
- 26s proteasome regulatory subunit 4 (49 kDa, Protein from Rattus norvegicus)
- 26s proteasome non-atpase regulatory subunit 13 (42 kDa, Protein from Rattus norvegicus)
- Rcg28037 (8 kDa, Protein from Rattus norvegicus)
- Proteasome 26s subunit, atpase 6 (45 kDa, Protein from Rattus norvegicus)
- Proteasome (prosome, macropain) 26s subunit, non-atpase, 6 (45 kDa, Protein from Rattus norvegicus)
- 26s proteasome subunit s5a (40 kDa, Protein from Rattus norvegicus)
- Proteasome (prosome, macropain) 26s subunit, non-atpase, 14 (34 kDa, Protein from Rattus norvegicus)
- Proteasome subunit alpha type-6 (27 kDa, Protein from Rattus norvegicus)
- 26s proteasome regulatory subunit 6b (47 kDa, Protein from Rattus norvegicus)
- Proteasome subunit alpha type-2 (25 kDa, Protein from Rattus norvegicus)
- Proteasome subunit beta type-2 (22 kDa, Protein from Rattus norvegicus)
- Proteasome (prosome, macropain) 26s subunit, non-atpase, 12 (53 kDa, Protein from Rattus norvegicus)
- Proteasome (prosome, macropain) 26s subunit, non-atpase, 3 (60 kDa, Protein from Rattus norvegicus)
- 26s proteasome non-atpase regulatory subunit 2 (100 kDa, Protein from Rattus norvegicus)
- Proteasome subunit beta type-3 (22 kDa, Protein from Rattus norvegicus)
- Proteasome subunit alpha type-5 (26 kDa, Protein from Rattus norvegicus)
- Proteasome subunit beta type-7 (29 kDa, Protein from Rattus norvegicus)
- Proteasome subunit beta type-6 (25 kDa, Protein from Rattus norvegicus)
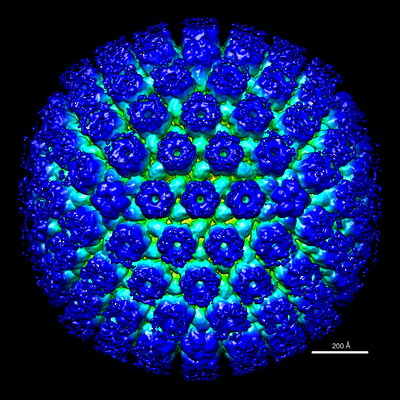
Pseudorabies GS-2168 B-capsid from cryo-electron microscopy
Homa FL, Huffman JB, Toropova K, Lopez HR, Makhov AM, Conway JF
J Mol Biol (2013) 425 pp. 3415-3428 [ Pubmed: 23827137 DOI: doi:10.1016/j.jmb.2013.06.034 ]


