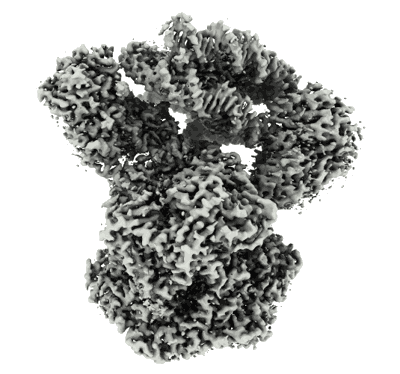
CryoEM Structure INO80core Hexasome complex composite map state1
Resolution: 2.8 Å
EM Method: Single-particle
Fitted PDBs: 8oo7
Q-score: 0.556
Zhang M, Jungblut A, Kunert F, Hauptmann L, Hoffmann T, Kolesnikova O, Metzner F, Moldt M, Weis F, DiMaio F, Hopfner KP, Eustermann S
Science (2023) 381 pp. 313-319 [ Pubmed: 37384673 DOI: doi:10.1126/science.adf6287 ]
- Ruvb-like protein 1 (50 kDa, Protein from Thermochaetoides thermophila)
- Adenosine-5'-diphosphate (427 Da, Ligand)
- Ino80 core module in complex with hexasome (861 kDa, Complex)
- Dna strand 2 (70 kDa, DNA from synthetic construct)
- Ruvb-like protein 2 (53 kDa, Protein from Thermochaetoides thermophila)
- Histone h3.1 (15 kDa, Protein from Homo sapiens)
- Histone h2a (14 kDa, Protein from Homo sapiens)
- Adenosine-5'-triphosphate (507 Da, Ligand)
- Chromatin-remodeling complex subunit ies6 (23 kDa, Protein from Thermochaetoides thermophila)
- Dna (Complex from Synthetic construct)
- Histone h2b (13 kDa, Protein from Homo sapiens)
- Dna strand 1 (69 kDa, DNA from synthetic construct)
- Magnesium ion (24 Da, Ligand)
- Histones (Complex from Homo sapiens)
- Tetrafluoroaluminate ion (102 Da, Ligand)
- Actin-related protein 5 (87 kDa, Protein from Thermochaetoides thermophila)
- Ino eighty subunit 2 (53 kDa, Protein from Thermochaetoides thermophila)
- Histone h4 (11 kDa, Protein from Homo sapiens)
- Chromatin remodeler ino80 (Complex from Thermochaetoides thermophila)
- Chromatin-remodeling atpase ino80 (130 kDa, Protein from Thermochaetoides thermophila)
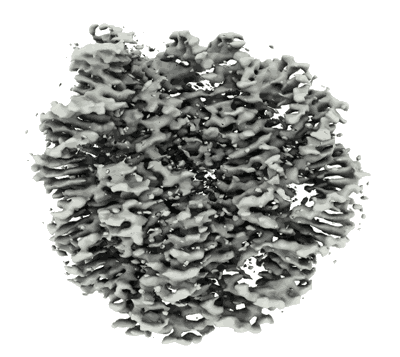
CryoEM Structure INO80core Hexasome complex Hexasome refinement state1
Resolution: 3.18 Å
EM Method: Single-particle
Fitted PDBs: 8ooa
Q-score: 0.525
Zhang M, Jungblut A, Kunert F, Hauptmann L, Hoffmann T, Kolesnikova O, Metzner F, Moldt M, Weis F, DiMaio F, Hopfner KP, Eustermann S
Science (2023) 381 pp. 313-319 [ Pubmed: 37384673 DOI: doi:10.1126/science.adf6287 ]
- Ino80 core module in complex with hexasome (861 kDa, Complex from Thermochaetoides thermophila)
- Histone h2b (13 kDa, Protein from Homo sapiens)
- Histone h3.1 (15 kDa, Protein from Homo sapiens)
- Histone h2a (14 kDa, Protein from Homo sapiens)
- Histone h4 (11 kDa, Protein from Homo sapiens)
- Dna strand 2 (70 kDa, DNA from synthetic construct)
- Dna strand 1 (69 kDa, DNA from synthetic construct)
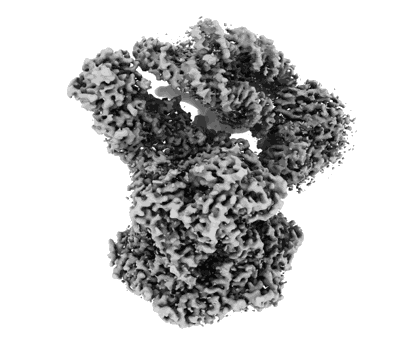
INO80 core bound to hexasome composite map of state 2
Resolution: 2.7 Å
EM Method: Single-particle
Fitted PDBs: 8oop
Q-score: 0.554
Zhang M, Jungblut A, Kunert F, Hauptmann L, Hoffmann T, Kolesnikova O, Metzner F, Moldt M, Weis F, DiMaio F, Hopfner KP, Eustermann S
Science (2023) 381 pp. 313-319 [ Pubmed: 37384673 DOI: doi:10.1126/science.adf6287 ]
- Ruvb-like protein 1 (50 kDa, Protein from Thermochaetoides thermophila)
- Adenosine-5'-diphosphate (427 Da, Ligand)
- Ino80 core module in complex with hexasome (861 kDa, Complex)
- Dna strand 2 (70 kDa, DNA from synthetic construct)
- Ruvb-like protein 2 (53 kDa, Protein from Thermochaetoides thermophila)
- Histone h3.1 (15 kDa, Protein from Homo sapiens)
- Histone h2a (14 kDa, Protein from Homo sapiens)
- Adenosine-5'-triphosphate (507 Da, Ligand)
- Chromatin-remodeling complex subunit ies6 (23 kDa, Protein from Thermochaetoides thermophila)
- Dna strand 1 (69 kDa, DNA from synthetic construct)
- Dna (Complex from Synthetic construct)
- Histone h2b (13 kDa, Protein from Homo sapiens)
- Magnesium ion (24 Da, Ligand)
- Histones (Complex from Homo sapiens)
- Tetrafluoroaluminate ion (102 Da, Ligand)
- Actin-related protein 5 (87 kDa, Protein from Thermochaetoides thermophila)
- Ino eighty subunit 2 (53 kDa, Protein from Thermochaetoides thermophila)
- Histone h4 (11 kDa, Protein from Homo sapiens)
- Chromatin remodeler ino80 (Complex from Thermochaetoides thermophila)
- Chromatin-remodeling atpase ino80 (130 kDa, Protein from Thermochaetoides thermophila)
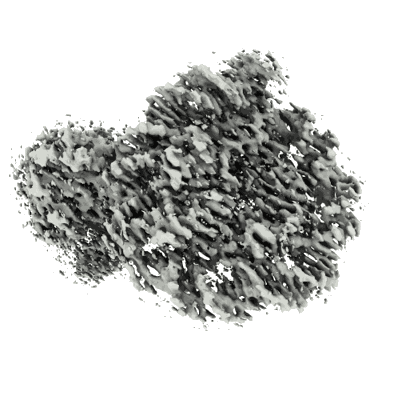
CryoEM Structure INO80core Hexasome complex ATPase-hexasome refinement state 2
Resolution: 3.29 Å
EM Method: Single-particle
Fitted PDBs: 8oos
Q-score: 0.494
Zhang M, Jungblut A, Kunert F, Hauptmann L, Hoffmann T, Kolesnikova O, Metzner F, Moldt M, Weis F, DiMaio F, Hopfner KP, Eustermann S
Science (2023) 381 pp. 313-319 [ Pubmed: 37384673 DOI: doi:10.1126/science.adf6287 ]
- Histone h2b (13 kDa, Protein from Homo sapiens)
- Magnesium ion (24 Da, Ligand)
- Histones (Complex from Homo sapiens)
- Tetrafluoroaluminate ion (102 Da, Ligand)
- Histone h3.1 (15 kDa, Protein from Homo sapiens)
- Adenosine-5'-diphosphate (427 Da, Ligand)
- Histone h2a (14 kDa, Protein from Homo sapiens)
- Ino80 core module in complex with hexasome (861 kDa, Complex)
- Histone h4 (11 kDa, Protein from Homo sapiens)
- Dna strand 2 (70 kDa, DNA from synthetic construct)
- Ino80 (Complex from Thermochaetoides thermophila)
- Dna strand 1 (69 kDa, DNA from synthetic construct)
- Chromatin-remodeling atpase ino80 (130 kDa, Protein from Thermochaetoides thermophila)
- Dna (Complex from Synthetic construct)

Class1 of the INO80-Hexasome complex
Resolution: 6.68 Å
EM Method: Single-particle
Fitted PDBs: 8ett
Q-score: 0.186
Wu H, Munoz EN, Hsieh LJ, Chio US, Gourdet MA, Narlikar GJ, Cheng Y
Science (2023) 381 pp. 319-324 [ DOI: doi:10.1126/science.adf4197 Pubmed: 37384669 ]
- Class1 hexasome in ino80-hexasome complex (Complex from Xenopus laevis)
- Dna (110-mer) (69 kDa, DNA from synthetic construct)
- Histone h4 (11 kDa, Protein from Xenopus laevis)
- Dna (110-mer) (70 kDa, DNA from synthetic construct)
- Histone h2b 1.1 (13 kDa, Protein from Xenopus laevis)
- Histone h3.2 (15 kDa, Protein from Xenopus laevis)
- Histone h2a type 1 (14 kDa, Protein from Xenopus laevis)

Class2 of the INO80-Hexasome complex
Resolution: 3.16 Å
EM Method: Single-particle
Fitted PDBs: 8etv
Q-score: 0.387
Wu H, Munoz EN, Hsieh LJ, Chio US, Gourdet MA, Narlikar GJ, Cheng Y
Science (2023) 381 pp. 319-324 [ DOI: doi:10.1126/science.adf4197 Pubmed: 37384669 ]
- Class2 hexasome in ino80-hexasome complex (Complex from Xenopus laevis)
- Histone h4 (11 kDa, Protein from Xenopus laevis)
- Dna (110-mer) (69 kDa, DNA from synthetic construct)
- Dna (110-mer) (70 kDa, DNA from synthetic construct)
- Histone h2b 1.1 (13 kDa, Protein from Xenopus laevis)
- Histone h3.2 (15 kDa, Protein from Xenopus laevis)
- Histone h2a type 1 (14 kDa, Protein from Xenopus laevis)

Class3 of the INO80-Hexasome complex
Resolution: 2.93 Å
EM Method: Single-particle
Fitted PDBs: 8eu2
Q-score: 0.434
Wu H, Munoz EN, Hsieh LJ, Chio US, Gourdet MA, Narlikar GJ, Cheng Y
Science (2023) 381 pp. 319-324 [ DOI: doi:10.1126/science.adf4197 Pubmed: 37384669 ]
- Dna (110-mer) (69 kDa, DNA from synthetic construct)
- Histone h4 (11 kDa, Protein from Xenopus laevis)
- Dna (110-mer) (70 kDa, DNA from synthetic construct)
- Histone h2b 1.1 (13 kDa, Protein from Xenopus laevis)
- Ino80-hex (Complex from Xenopus laevis)
- Histone h3.2 (15 kDa, Protein from Xenopus laevis)
- Histone h2a type 1 (14 kDa, Protein from Xenopus laevis)

Class1 of the INO80-Nucleosome complex
Resolution: 3.48 Å
EM Method: Single-particle
Fitted PDBs: 8eue
Q-score: 0.356
Wu H, Munoz EN, Hsieh LJ, Chio US, Gourdet MA, Narlikar GJ, Cheng Y
Science (2023) 381 pp. 319-324 [ DOI: doi:10.1126/science.adf4197 Pubmed: 37384669 ]
- Class1 nucleosome of the ino80-nucleosome complex (Complex from Xenopus)
- Histone h2b 1.1 (13 kDa, Protein from Xenopus)
- Histone h3.2 (15 kDa, Protein from Xenopus)
- Histone h4 (11 kDa, Protein from Xenopus)
- Dna (147-mer) (70 kDa, DNA from synthetic construct)
- Dna (147-mer) (69 kDa, DNA from synthetic construct)
- Histone h2a type 1 (14 kDa, Protein from Xenopus)

Class2 of the INO80-Nucleosome complex
Resolution: 3.36 Å
EM Method: Single-particle
Fitted PDBs: 8euj
Q-score: 0.322
Wu H, Munoz EN, Hsieh LJ, Chio US, Gourdet MA, Narlikar GJ, Cheng Y
Science (2023) 381 pp. 319-324 [ DOI: doi:10.1126/science.adf4197 Pubmed: 37384669 ]
- Histone h2b 1.1 (13 kDa, Protein from Xenopus)
- Histone h3.2 (15 kDa, Protein from Xenopus)
- Histone h4 (11 kDa, Protein from Xenopus)
- Dna (147-mer) (70 kDa, DNA from synthetic construct)
- Class2 nucleosome of the ino80-nucleosome complex (Complex from Xenopus)
- Dna (147-mer) (69 kDa, DNA from synthetic construct)
- Histone h2a type 1 (14 kDa, Protein from Xenopus)

Human menin in complex with H3K79Me2 nucleosome
Resolution: 3.2 Å
EM Method: Single-particle
Fitted PDBs: 8gpn
Q-score: 0.459
Lin J, Wu Y, Tian G, Yu D, Yang E, Lam WH, Liu Z, Jing Y, Dang S, Bao X, Wong JWH, Zhai Y, Li XD
Science (2023) 379 pp. 717-723 [ Pubmed: 36795828 DOI: doi:10.1126/science.adc9318 ]
- Histone h4 (11 kDa, Protein from Xenopus laevis)
- Dna (177-mer) (Complex from Homo sapiens)
- Human menin in complex with nh3k79 dimethylated nucleosome (300 kDa, Complex from Xenopus laevis)
- Isoform 2 of menin (Complex)
- Histone h2a type 1 (13 kDa, Protein from Xenopus laevis)
- Nh3k79 dimethylated nucleosome (Complex)
- Histone h3.2 (15 kDa, Protein from Xenopus laevis)
- Dna (177-mer) (54 kDa, DNA from Homo sapiens)
- Histone h2b 1.1 (13 kDa, Protein from Xenopus laevis)
- Isoform 2 of menin (67 kDa, Protein from Homo sapiens)
- Dna (177-mer) (54 kDa, DNA from Homo sapiens)