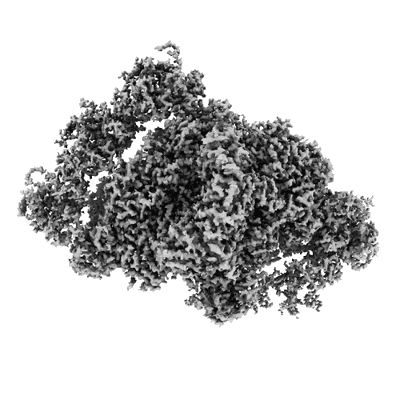
PSI-LHCI of the red alga Cyanidium caldarium RK-1 (NIES-2137)
Resolution: 1.92 Å
EM Method: Single-particle
Fitted PDBs: 8wey
Q-score: 0.662
Kato K, Hamaguchi T, Kumazawa M, Nakajima Y, Ifuku K, Hirooka S, Hirose Y, Miyagishima SY, Suzuki T, Kawakami K, Dohmae N, Yonekura K, Shen JR, Nagao R
PNAS (2024) 121 pp. e2319658121-e2319658121 [ DOI: doi:10.1073/pnas.2319658121 Pubmed: 38442179 ]
- Photosystem i reaction center subunit iii (20 kDa, Protein from Cyanidium caldarium)
- Digalactosyl diacyl glycerol (dgdg) (949 Da, Ligand)
- Photosystem i reaction center subunit ix (4 kDa, Protein from Cyanidium caldarium)
- Photosystem i iron-sulfur center (8 kDa, Protein from Cyanidium caldarium)
- Photosystem i subunit o (16 kDa, Protein from Cyanidium caldarium)
- Photosystem i reaction center subunit ii (15 kDa, Protein from Cyanidium caldarium)
- Photosystem i p700 chlorophyll a apoprotein a1 (82 kDa, Protein from Cyanidium caldarium)
- Lhcr3 (23 kDa, Protein from Cyanidium caldarium)
- Phylloquinone (450 Da, Ligand)
- Photosystem i reaction center subunit xii (3 kDa, Protein from Cyanidium caldarium)
- Photosystem i reaction center subunit xi (15 kDa, Protein from Cyanidium caldarium)
- Iron/sulfur cluster (351 Da, Ligand)
- Dodecyl-beta-d-maltoside (510 Da, Ligand)
- Photosystem i p700 chlorophyll a apoprotein a2 (82 kDa, Protein from Cyanidium caldarium)
- Zeaxanthin (568 Da, Ligand)
- Lhcr1 (24 kDa, Protein from Cyanidium caldarium)
- 1,2-dipalmitoyl-phosphatidyl-glycerole (722 Da, Ligand)
- Water (18 Da, Ligand)
- Photosystem i reaction center subunit viii (3 kDa, Protein from Cyanidium caldarium)
- Chlorophyll a (893 Da, Ligand)
- Beta-carotene (536 Da, Ligand)
- Unknown ligand (Ligand)
- Psi-lhci (550 kDa, Complex from Cyanidium caldarium)
- Photosystem i reaction center subunit x (7 kDa, Protein from Cyanidium caldarium)
- Lhcr2 (24 kDa, Protein from Cyanidium caldarium)
- Chlorophyll a isomer (893 Da, Ligand)
- Photosystem i reaction center subunit iv (6 kDa, Protein from Cyanidium caldarium)
Cryo-EM structure of cyanobacterial photosystem I in the presence of ferredoxin and cytochrome c6
Resolution: 1.97 Å
EM Method: Single-particle
Fitted PDBs: 7fix
Q-score: 0.651
Li J, Hamaoka N, Makino F, Kawamoto A, Lin Y, Rogner M, Nowaczyk MM, Lee YH, Namba K, Gerle C, Kurisu G
Commun Biol (2022) 5 pp. 951-951 [ Pubmed: 36097054 DOI: doi:10.1038/s42003-022-03926-4 ]
- Photosystem i reaction center subunit psak (8 kDa, Protein from Thermosynechococcus vestitus BP-1)
- Photosystem i 4.8k protein (4 kDa, Protein from Thermosynechococcus vestitus BP-1)
- Photosystem i reaction center subunit ix (4 kDa, Protein from Thermosynechococcus vestitus BP-1)
- Photosystem i reaction center subunit ii (15 kDa, Protein from Thermosynechococcus vestitus BP-1)
- Cryo-em map of cyanobacterial photosystem i in the presence of ferredoxin and cytochrome c6 (1 MDa, Complex from Thermosynechococcus elongatus BP-1)
- Photosystem i reaction center subunit xi (16 kDa, Protein from Thermosynechococcus vestitus BP-1)
- Photosystem i reaction center subunit viii (4 kDa, Protein from Thermosynechococcus vestitus BP-1)
- Unknown ligand (40 Da, Ligand)
- Photosystem i trimer (Complex)
- Water (18 Da, Ligand)
- Photosystem i iron-sulfur center (8 kDa, Protein from Thermosynechococcus vestitus BP-1)
- Chlorophyll a (893 Da, Ligand)
- Chlorophyll a isomer (893 Da, Ligand)
- [2ga-2s] cluster (203 Da, Ligand)
- Ferredoxin-1 (10 kDa, Protein from Thermosynechococcus vestitus BP-1)
- Photosystem i reaction center subunit iii (19 kDa, Protein from Thermosynechococcus vestitus BP-1)
- Iron/sulfur cluster (351 Da, Ligand)
- Photosystem i reaction center subunit xii (3 kDa, Protein from Thermosynechococcus vestitus BP-1)
- Calcium ion (40 Da, Ligand)
- Digalactosyl diacyl glycerol (dgdg) (949 Da, Ligand)
- Photosystem i reaction center subunit iv (8 kDa, Protein from Thermosynechococcus vestitus BP-1)
- Phylloquinone (450 Da, Ligand)
- Photosystem i p700 chlorophyll a apoprotein a1 (83 kDa, Protein from Thermosynechococcus vestitus BP-1)
- Ga-substituted ferredoxin (Complex from Thermosynechococcus elongatus BP-1)
- Beta-carotene (536 Da, Ligand)
- Photosystem i p700 chlorophyll a apoprotein a2 (83 kDa, Protein from Thermosynechococcus vestitus BP-1)
- 1,2-dipalmitoyl-phosphatidyl-glycerole (722 Da, Ligand)


