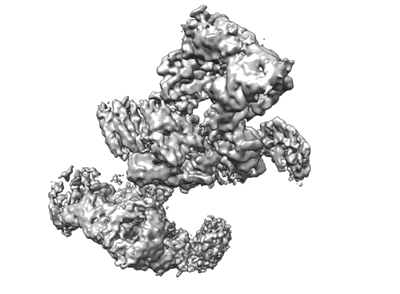
Structure of Fanconi anaemia core complex (consensus map)
Resolution: 4.2 Å
EM Method: Single-particle
Fitted PDBs: 6sri
Q-score: 0.112
Shakeel S, Rajendra E, Alcon P, O'Reilly F, Chorev DS, Maslen S, Degliesposti G, Russo CJ, He S, Hill CH, Skehel JM, Scheres SHW, Patel KJ, Rappsilber J, Robinson CV, Passmore LA
Nature (2019) 575 pp. 234-237 [ DOI: doi:10.1038/s41586-019-1703-4 Pubmed: 31666700 ]
- Unassigned secondary structure elements (proposed faap100) (3 kDa, Protein from Gallus gallus)
- Unassigned secondary structure elements (central region, proposed fancb-faap100) (783 Da, Protein from Gallus gallus)
- Unassigned secondary structure elements (proposed fancb) (23 kDa, Protein from Gallus gallus)
- Unassigned secondary structure elements (base region, proposed fancc-fanc-e-fancf) (7 kDa, Protein from Gallus gallus)
- Base region, proposed fancf (17 kDa, Protein from Gallus gallus)
- Fanconi anaemia core complex (860 kDa, Complex from Gallus gallus)
- Unassigned secondary structure elements (proposed faap100) (23 kDa, Protein from Gallus gallus)
- Unassigned secondary structure elements (base region, proposed fancc-fanc-e-fancf) (1 kDa, Protein from Gallus gallus)
- Unassigned secondary structure elements (base region, proposed fancc-fanc-e-fancf) (9 kDa, Protein from Gallus gallus)
- Unassigned secondary structure elements (base region, proposed fancc-fanc-e-fancf) (6 kDa, Protein from Gallus gallus)
- Unassigned secondary structure elements (central region, proposed fancb-faap100) (1 kDa, Protein from Gallus gallus)
- Unassigned secondary structure elements (central region, proposed fancb-faap100) (1 kDa, Protein from Gallus gallus)
- Unassigned secondary structure elements (base region, proposed fancc-fanc-e-fancf) (5 kDa, Protein from Gallus gallus)
- Unassigned secondary structure elements (central region, proposed fancb-faap100) (3 kDa, Protein from Gallus gallus)
- Unassigned secondary structure elements (central region, proposed fancb-faap100) (2 kDa, Protein from Gallus gallus)
- Unassigned secondary structure elements (base region, proposed fancc-fanc-e-fancf) (1 kDa, Protein from Gallus gallus)
- Unassigned secondary structure elements (proposed fancb) (10 kDa, Protein from Gallus gallus)
- Unassigned secondary structure elements (central region, proposed fancb-faap100) (1 kDa, Protein from Gallus gallus)
- Fanconi anaemia protein fancl (42 kDa, Protein from Gallus gallus)
- Unassigned secondary structure elements (central region, proposed fancb-faap100) (1 kDa, Protein from Gallus gallus)
- Unassigned secondary structure elements (central region, proposed fancb-faap100) (2 kDa, Protein from Gallus gallus)
- Unassigned secondary structure elements (top region, proposed fancg) (12 kDa, Protein from Gallus gallus)
- Unassigned secondary structure elements (central region, proposed fancb-faap100) (2 kDa, Protein from Gallus gallus)
- Unassigned secondary structure elements (base region, proposed fancc-fanc-e-fancf) (19 kDa, Protein from Gallus gallus)
- Unassigned secondary structure elements (central region, proposed fancb-faap100: chain a,a; base region, proposed fancc-fanc-e-fancf: chain 3) (6 kDa, Protein from Gallus gallus)
- Unassigned secondary structure elements (central region, proposed fancb-faap100: chain f,f; base region, proposed fancc-fanc-e-fancf: chain z) (1 kDa, Protein from Gallus gallus)
- Unassigned secondary structure elements (base region, proposed fancc-fanc-e-fancf) (2 kDa, Protein from Gallus gallus)
- Unassigned secondary structure elements (top region, proposed fancg) (24 kDa, Protein from Gallus gallus)
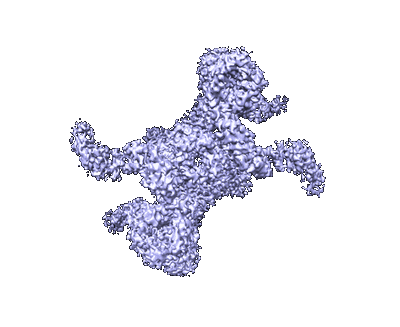
Structure of the Fanconi anaemia core subcomplex
Resolution: 4.6 Å
EM Method: Single-particle
Fitted PDBs: 6srs
Q-score: 0.135
Shakeel S, Rajendra E, Alcon P, O'Reilly F, Chorev DS, Maslen S, Degliesposti G, Russo CJ, He S, Hill CH, Skehel JM, Scheres SHW, Patel KJ, Rappsilber J, Robinson CV, Passmore LA
Nature (2019) 575 pp. 234-237 [ DOI: doi:10.1038/s41586-019-1703-4 Pubmed: 31666700 ]
- Unassigned secondary structure elements (proposed faap100) (3 kDa, Protein from Gallus gallus)
- Unassigned secondary structure elements (central region, proposed fancb-faap100) (783 Da, Protein from Gallus gallus)
- Unassigned secondary structure elements (proposed fancb) (23 kDa, Protein from Gallus gallus)
- Unassigned secondary structure elements (proposed faap100) (23 kDa, Protein from Gallus gallus)
- Unassigned secondary structure elements (central region, proposed fancb-faap100) (1 kDa, Protein from Gallus gallus)
- Unassigned secondary structure elements (central region, proposed fancb-faap100) (1 kDa, Protein from Gallus gallus)
- Unassigned secondary structure elements (central region, proposed fancb-faap100) (3 kDa, Protein from Gallus gallus)
- Unassigned secondary structure elements (central region, proposed fancb-faap100) (2 kDa, Protein from Gallus gallus)
- Unassigned secondary structure elements (proposed fancb) (10 kDa, Protein from Gallus gallus)
- Unassigned secondary structure elements (central region, proposed fancb-faap100) (1 kDa, Protein from Gallus gallus)
- Unassigned secondary structure elements (central region, proposed fancb-faap100) (1 kDa, Protein from Gallus gallus)
- Unassigned secondary structure elements (central region, proposed fancb-faap100) (1 kDa, Protein from Gallus gallus)
- Unassigned secondary structure elements (central region, proposed fancb-faap100) (2 kDa, Protein from Gallus gallus)
- Fanconi anaemia protein fancl (10 kDa, Protein from Gallus gallus)
- Unassigned secondary structure elements (proposed fancg) (12 kDa, Protein from Gallus gallus)
- Unassigned secondary structure elements (central region, proposed fancb-faap100) (2 kDa, Protein from Gallus gallus)
- Fanconi anaemia core subcomplex (860 kDa, Complex from Gallus gallus)
- Unassigned secondary structure elements (central region, proposed fancb-faap100) (6 kDa, Protein from Gallus gallus)
- Unassigned secondary structure elements (proposed fancg) (24 kDa, Protein from Gallus gallus)


