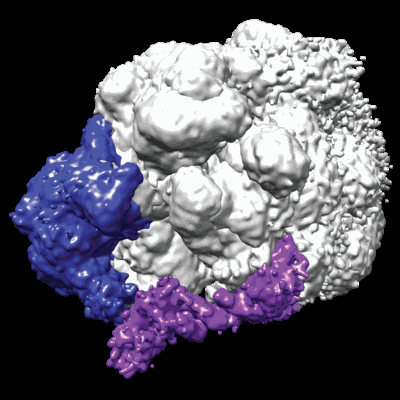
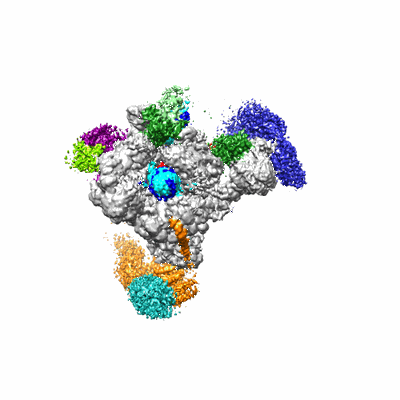
Resolution: 3.1 Å
EM Method: Single-particle
Fitted PDBs: 6ted
Q-score: 0.338
Vos SM, Farnung L, Linden A, Urlaub H, Cramer P
Nat Struct Mol Biol (2020) 27 pp. 668-677 [ DOI: doi:10.1038/s41594-020-0437-1 Pubmed: 32541898 ]
- Rna polymerase ii-associated factor 1 homolog (60 kDa, Protein from Homo sapiens)
- Dna-directed rna polymerase ii subunit rpb9 (14 kDa, Protein from Sus scrofa)
- Wd repeat-containing protein 61 (33 kDa, Protein from Homo sapiens)
- Transcription elongation factor spt5 (121 kDa, Protein from Homo sapiens)
- Rna polymerase-associated protein leo1 (75 kDa, Protein from Homo sapiens)
- Pig dna/rna polymerase subunits (Complex from Sus scrofa)
- Complete ec* (1 MDa, Complex)
- Rna polymerase ii subunit c (31 kDa, Protein from Sus scrofa)
- Human transcription factors and associated proteins (Complex from Homo sapiens)
- Rna (5'-r(p*up*ap*ap*cp*cp*gp*gp*ap*gp*ap*gp*gp*gp*ap*ap*cp*cp*cp*ap*cp*u)-3') (14 kDa, RNA from synthetic construct)
- Transcription elongation factor spt4 (13 kDa, Protein from Homo sapiens)
- Dna/rna (Complex from synthetic construct)
- Rna polymerase ii subunit e (24 kDa, Protein from Sus scrofa)
- Transcription elongation factor spt4 and spt5 (Complex from Homo sapiens)
- Template dna (14 kDa, DNA from synthetic construct)
- Rna polymerase ii subunit d (16 kDa, Protein from Sus scrofa)
- Rna polymerase ii subunit g (19 kDa, Protein from Sus scrofa)
- Dna-directed rna polymerases i, ii, and iii subunit rpabc3 (17 kDa, Protein from Sus scrofa)
- Dna (37-mer) (14 kDa, DNA from synthetic construct)
- Rna polymerase-associated protein ctr9 homolog (134 kDa, Protein from Homo sapiens)
- Transcription elongation factor spt6 (199 kDa, Protein from Homo sapiens)
- Magnesium ion (24 Da, Ligand)
- Rna polymerase-associated protein rtf1 homolog (80 kDa, Protein from Homo sapiens)
- Uncharacterized protein (7 kDa, Protein from Sus scrofa)
- Zinc ion (65 Da, Ligand)
- Uncharacterized protein (7 kDa, Protein from Sus scrofa)
- Dna-directed rna polymerase subunit beta (142 kDa, Protein from Sus scrofa)
- Dna-directed rna polymerase subunit (219 kDa, Protein from Sus scrofa)
- Parafibromin (60 kDa, Protein from Homo sapiens)
- Uncharacterized protein (13 kDa, Protein from Sus scrofa)
- Rna polymerase ii subunit f (14 kDa, Protein from Sus scrofa)
Structure of paused transcription complex Pol II-DSIF-NELF
Resolution: 3.2 Å
EM Method: Single-particle
Fitted PDBs: 6gml
Q-score: 0.34
Vos SM, Farnung L, Urlaub H, Cramer P
Nature (2018) 560 pp. 601-606 [ DOI: doi:10.1038/s41586-018-0442-2 Pubmed: 30135580 ]
- Transcription elongation factor spt5 (121 kDa, Protein from Homo sapiens)
- Dna-directed rna polymerase ii subunit rpb9 (14 kDa, Protein from Sus scrofa)
- Negative elongation factor (nelf) (Complex from Homo sapiens)
- Negative elongation factor a (57 kDa, Protein from Homo sapiens)
- Dna-directed rna polymerase subunit (217 kDa, Protein from Sus scrofa)
- Negative elongation factor e,negative elongation factor e (45 kDa, Protein from Homo sapiens)
- Hiv-1 pause transcription scaffold (Complex from Human immunodeficiency virus 1)
- Rna polymerase ii subunit c (30 kDa, Protein from Sus scrofa)
- Transcription elongation factor spt4 (13 kDa, Protein from Homo sapiens)
- Rna polymerase ii subunit e (24 kDa, Protein from Sus scrofa)
- Sus scrofa rna polymerase ii (Complex from Sus scrofa)
- Rna polymerase ii subunit d (16 kDa, Protein from Sus scrofa)
- Drb sensitivity inducing factor (dsif) (Complex from Human immunodeficiency virus 1)
- Negative elongation factor c/d (64 kDa, Protein from Homo sapiens)
- Dna-directed rna polymerases i, ii, and iii subunit rpabc3 (17 kDa, Protein from Sus scrofa)
- Tar rna (14 kDa, RNA from Human immunodeficiency virus 1)
- Rna polymerase ii subunit g (19 kDa, Protein from Sus scrofa)
- Magnesium ion (24 Da, Ligand)
- Uncharacterized protein (7 kDa, Protein from Sus scrofa)
- Zinc ion (65 Da, Ligand)
- Template dna (14 kDa, DNA from Human immunodeficiency virus 1)
- Rna polymerase ii elongation complex bound to dsif and nelf (927 kDa, Complex)
- Uncharacterized protein (7 kDa, Protein from Sus scrofa)
- Dna-directed rna polymerase subunit beta (134 kDa, Protein from Sus scrofa)
- Non-template dna (14 kDa, DNA from Human immunodeficiency virus 1)
- Negative elongation factor b,negative elongation factor b (64 kDa, Protein from Homo sapiens)
- Uncharacterized protein (13 kDa, Protein from Sus scrofa)
- Rna polymerase ii subunit f (14 kDa, Protein from Sus scrofa)
Structure of activated transcription complex Pol II-DSIF-PAF-SPT6 (Map A)
Vos SM, Farnung L, Boehning M, Wigge C, Linden A, Urlaub H, Cramer P
Nature (2018) 560 pp. 607-612 [ Pubmed: 30135578 DOI: doi:10.1038/s41586-018-0440-4 ]
- Transcription elongation factor spt5 (121 kDa, Protein from Homo sapiens)
- Dna-directed rna polymerase ii subunit rpb9 (14 kDa, Protein from Sus scrofa)
- Rpb1 (217 kDa, Protein from Sus scrofa)
- Wd repeat-containing protein 61 (33 kDa, Protein from Homo sapiens)
- Rna polymerase ii (Complex from Sus scrofa)
- Ctr9,rna polymerase-associated protein ctr9 homolog,rna polymerase-associated protein ctr9 homolog (125 kDa, Protein from Homo sapiens)
- Rpb11 (13 kDa, Protein from Sus scrofa)
- Rna polymerase ii subunit c (31 kDa, Protein from Sus scrofa)
- Rna polymerase ii-dsif-paf-spt6 elongation complex (ec*) (1 MDa, Complex)
- Rna (14 kDa, RNA from synthetic construct)
- Transcription elongation factor spt4 (13 kDa, Protein from Homo sapiens)
- Associated proteins (Complex from Homo sapiens)
- Rna polymerase ii subunit e (24 kDa, Protein from Sus scrofa)
- Nucleic acids (Complex from synthetic construct)
- Template dna (14 kDa, DNA from synthetic construct)
- Leo1,leo1,rna polymerase-associated protein leo1 (84 kDa, Protein from Homo sapiens)
- Transcription elongation factor spt6,transcription elongation factor spt6,transcription elongation factor spt6 (198 kDa, Protein from Homo sapiens)
- Rna polymerase ii subunit d (16 kDa, Protein from Sus scrofa)
- Rna polymerase ii subunit g (19 kDa, Protein from Sus scrofa)
- Dna-directed rna polymerases i, ii, and iii subunit rpabc3 (17 kDa, Protein from Sus scrofa)
- Magnesium ion (24 Da, Ligand)
- Cdc73 (1 kDa, Protein from Homo sapiens)
- Zinc ion (65 Da, Ligand)
- Rpb10 (7 kDa, Protein from Sus scrofa)
- Dna-directed rna polymerase subunit beta (134 kDa, Protein from Sus scrofa)
- Paf1,rna polymerase ii-associated factor 1 homolog,rna polymerase ii-associated factor 1 homolog (67 kDa, Protein from Homo sapiens)
- Non-template dna (14 kDa, DNA from synthetic construct)
- Rna polymerase ii subunit f (14 kDa, Protein from Sus scrofa)
- Rpb12 (7 kDa, Protein from Sus scrofa)


