- Course overview
- Search within this course
- Introduction
- Real-time PCR
- Microarrays
- What is Next Generation DNA Sequencing?
- RNA sequencing
- Biological interpretation of gene expression data
- Genotyping, epigenetic and DNA/RNA-protein interaction methods
- DNA/RNA-protein interactions
- Summary
- Quiz: Check your learning
- Your feedback
- Learn more
- References
![]()
All materials are free cultural works licensed under a Creative Commons Attribution 4.0 International (CC BY 4.0) license, except where further licensing details are provided.
Biological interpretation of gene expression data
Many of the methods for visualising and interpreting gene expression data can be used for both microarray and RNA-seq experiments. Some of the most common methods are discussed below.
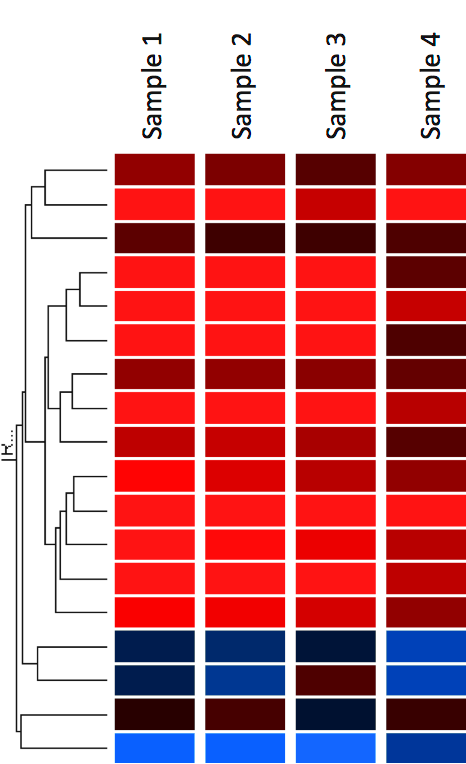
Heatmaps and clustering
A common method of visualising gene expression data is to display it as a heatmap (Figure 17). The heatmap may also be combined with clustering methods which group genes and/or samples together based on the similarity of their gene expression pattern. This can be useful for identifying genes that are commonly regulated, or biological signatures associated with a particular condition (e.g a disease or an environmental condition) (4).
In heat maps the data is displayed in a grid where each row represents a gene and each column represents a sample. The colour and intensity of the boxes is used to represent changes (not absolute values) of gene expression. In the example below, red represents up-regulated genes and blue represents down-regulated genes. Black represents unchanged expression.
Gene set enrichment analysis and pathway analysis
A common approach to interpreting gene expression data is gene set enrichment analysis based on the functional annotation of the differentially expressed genes (Figure 18). This is useful for finding out if the differentially expressed genes are associated with a certain biological process or molecular function.
The Gene Ontology, containing standardised annotation of gene products, is commonly used for this purpose. It works by comparing the frequency of individual annotations in the gene list (e.g differentially expressed genes) with a reference list (usually all genes on the microarray or in the genome). Enrichment of biological pathways supplied by KEGG, Ingenuity, Reactome or WikiPathways can be performed in a similar way (12,13).
Popular tools for gene set enrichment and pathway analysis include:

Network analysis
Network analysis is complementary to pathway analysis and can be used to show how key components of different pathways interact. This can be useful for identifying regulatory events that influence multiple biological processes and pathways (12,13).