In the following, a number of commonly used validation criteria are discussed. For every criterion, an indication of its usefulness for validation purposes is provided. In all cases, one should treat the outliers of any tests with caution (and verify them using the experimental data, if possible). Also, any property that is restrained during refinement of the model cannot be used for independent validation of that model (Goodhart's Law applied to structure determination). For instance, if one were to restrain side-chains to favourable conformations (rotamers) then the chi-torsion combinations are no longer a useful validation criterion. Also, if a model scores very poorly overall for one or more tests, it should be treated with caution. The same is true at the local level: a stretch of residues in a model that contains many outliers for one or more criteria may lack solid support in the experimental data.
Refresher
- If you have forgotten what amino acids are, look here or here
- If you have forgotten what molecular geometry is, look here
- If you have forgotten what dihedral or torsion angles are, look here
- If you have forgotten what eclipsed and staggered conformations are, look here
- If you have forgotten what chiral carbon atoms are, look here
- If you have forgotten what phi and psi are, look here
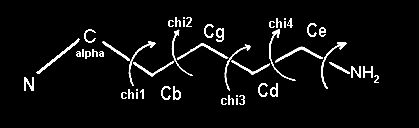
- If you have forgotten what chi-1, chi-2 etc. are, look here
Coordinates and temperature factors
The majority of model-quality criteria are based on the use of the (X,Y,Z) coordinates of the atoms in the model, their nature (e.g., carboxylate oxygen or aromatic carbon), and their identity (e.g., the main-chain nitrogen atom of leucine residue 64). Often these criteria compare properties of the model against expectations based on chemistry, physics, or analysis of a large collection of (protein or small-molecule) structures. (Such databases are essentially an embodiment of the underlying chemistry and physics, provided they are unbiased and contain only data derived from high-quality structures.) Here we shall have a look at some of the criteria that are often used in practice.
The covalent geometry of a model can be assessed by comparing bond lengths and angles to a library of "ideal" values. In the past, every refinement and modelling program had its own set of "ideal" values. This even made it possible to detect (with 95% accuracy) with which program a model had been refined, simply by inspecting its covalent geometry. Nowadays, standard sets of ideal bond lengths and bond angles, derived from an analysis of small-molecule crystal structures, are available for proteins and nucleic acids.
For bond lengths, the RMS deviation from ideal values is typically quoted. Deviations from ideality of bond angles can be expressed directly as an angular RMS deviation or in terms of angle distances (i.e., the angle ABC is measured by the 1-3 distance |AC|). Nowadays, RMS-Z-values of bond lengths and bond angles are preferred as they are more informative (but these values are not always provided in papers). Other checks in this class include chirality and planarity tests.
Validation potential of geometric tests: poor. Good scores for these criteria prove little. However, if an entire model scores poorly, this should set off warning bells. Also, gross outliers should always be investigated! Modern refinement programs normally produce models with few (if any) outliers.
Q. 1. Which amino acids contain chiral carbon atoms? Are there any amino acids that contain more than one chiral carbon atom? If so, which one(s)?
Q. 2. Currently there are 22 (rather than 20) known naturally occurring, genetically encoded amino acids. Number 21 has one-letter code U and number 22 has one-letter code O. What are the names and three-letter codes of these two amino acids? How many PDB entries contain at least one of them?
Q. 3. Do you expect the CB atom of a tyrosine residue to lie in the same plane as the aromatic ring?
Q. 4. Using your favourite graphics program or web-based 3D viewer, have a look at residue TRP D67 in PDB entry 7GPB. Does anything strike you as odd?
The conformation of the backbone of every non-terminal amino-acid residue is determined by three torsion angles, called:
- phi (C[i-1]-N[i]-CA[i]-C[i])
- psi (N[i]-CA[i]-C[i]-N[i+1])
- omega (CA[i]-C[i]-N[i+1]-CA[i+1])
Due to resonance, the peptide bond has partial double-bond character. Therefore, the omega torsion angle is restrained to values near 0 (cis-peptide) and 180 degrees (trans-peptide). Cis-peptides are relatively rare and usually (but not always) occur if the next residue is a proline. The omega angle therefore offers little in the way of validation checks, although values in the range of ±20 to ±160 degrees should be treated with caution in anything but very high-resolution models.
Validation potential of omega: poor. Cis-peptides are rare, and unusual values should be treated with caution.
The phi and psi torsion angles, on the other hand, are much less restricted, but it has been known for a long time that, due to steric hindrance, there are several clearly preferred combinations of phi, psi values. (A scatter plot of phi, psi values for all residues in a protein model is called a Ramachandran plot.) This is true even for proline and glycine residues, although their distributions are atypical. Also, the overwhelming majority of residues that are not in regular secondary structure elements are found to have favourable phi, psi torsion-angle combinations. For these reasons, the Ramachandran plot is an extremely simple, useful and sensitive indicator of model quality. Residues that have unusual phi, psi torsion-angle combinations should be scrutinised by the crystallographer. If they have convincing electron density, there is probably a good structural or functional reason for the protein to tolerate the energetic strain that is associated with the unusual conformation. The quality of a model's Ramachandran plot is most convincingly illustrated with a figure. Alternatively, the fraction of residues in certain predefined areas of the plot (e.g., core regions) can be quoted, but in that case it is important to indicate which definition of such areas was used. (For example, ProCheck and MolProbity use very different areas and many residues that are considered to be fine by ProCheck will nevertheless be considered outliers by MolProbity.)
If you are interested in finding out which specific steric clashes put restrictions on phi and/or psi, read the 2003 paper by Ho et al. They found that O(i-1)...CB(i) restricts phi of residue i, CB(i)...O(i) and CB(i)...N(i+1) restrict psi, and O(i-1)...O(i) and O(i-1)...N(i+1) restrict both phi and psi.
Validation potential of phi, psi combinations: excellent. A quick look at the Ramachandran plot will tell you a lot about the quality of a model. Good models have most residues tightly clustered in the most-favoured regions with relatively few outliers. Good, but low-resolution models may have less pronounced clustering, but will still have few outliers. Models that show poor clustering and many outliers are bound to be poor.

The figure (from 1996) shows the distribution of phi, psi torsion-angle combinations for more than 80,000 residues in the PDB at the time. Densely populated regions are shown in blue and green, whereas red and orange indicate scarcely populated areas. Similar figures for each of the twenty commonly occurring amino-acid residue types can be found here.
Q. 5. The three most-densely populated areas in the Ramachandran plot are called the alpha, the beta, and the left-handed helical region. Where are these three regions located approximately in the Ramachandran plot?
Q. 6. Why do glycine residues have an atypical distribution? And proline residues?
Q. 7. Which regions would you expect to be most favourable in the Ramachandran plot of a protein that consists entirely of D-amino acids?

